Data Tables
Data Tables
Data is set of information. For large sets of data, it is often easier to understand if it is displayed in a table.
Your child needs to be able to read information from a given table, and also be able to complete a table using the information in the question.
Understanding Tables
Each table will look slightly different. It is important for your child to read the headings for the rows and columns carefully to make sure they are picking out the correct information.
Example:
The table below shows the number of students visiting a school library on each day last week. Write down:
a) How many students visited the library on Wednesday
b) How many students in total visited the library over the week

a) If we look at the column for Wednesday, we can see that students visited the library on Wednesday.
b) Adding up for each day as we go across the row, we can see that students visited the library over the week.

Grouped Tables
Sometimes tables display information in groups, or categories.

Example: This table shows the ages, in years, of customers at a hairdresser’s salon during a day.
Rather than telling us the exact age of each person, the ages are displayed as categories.
Frequency means ‘how many’, so the table is telling us that customers were aged between and years, customers were aged between and years, and so on.
It is important that the categories do not overlap, so the first category ends at years, and the next category starts at years. This means it is impossible for anyone to fall into more than one category.
Example : Interpreting Grouped Tables

Anna asked her friends how many pairs of shoes they own. The results are shown in the table.
a) How many people owned between and pairs?
b) How many people owned pairs or more?
c) How many people did Anna ask in total?
a) Reading across the row for we can see that people owned between and pairs.
b) pairs or more means we need to look at the categories for both and over , and add them together. So this would be people.
c) This means we need to find the total of the frequency column. So she asked people in total.
Two-Way Tables
A two-way table has a total for each row and column.
Example: A bag contains wooden shapes. The shapes are either squares or circles, and they are painted either orange or blue. This information is shown in the two-way table below.
a) Write down how many orange circles are in the bag
b) Write down how many shapes there are in total in the bag

a) If we read down the column for orange until we reach circles, we can see that there are circles.
b) To find the overall total, we need to look in the bottom right corner, where the column for total and row for total cross. We can see that there are shapes in total in the bag.
Example : Completing a Table
Your child may be given a partially filled in table, and asked to complete it.
Example: A group of children were asked whether they preferred tea or coffee. The results are shown in the table below. Complete the table.

Each row and column must add up to the correct total. When filling in the missing values, always look for a row or column with one gap.
Let’s start by looking at the row for tea. We know the total must be , so the missing value for girls must be

Now let’s look at the column for boys. The column needs to add up to , so the missing value for coffee must be

Looking at the column for girls, the total must be

Looking at the row for coffee, the total must be

For the final missing value, we have a choice. We can either look down the last column, or across the bottom row. Both should give us the same total. Adding up the last column gives and adding up the bottom row gives , so we get the same value either way! This is a good double check.

So the completed table looks like this:

Data Tables Example Questions
Question 1: Harry runs a sandwich shop. Yesterday, he had orders in total for different types of sandwiches.
How many orders did he have for ham sandwiches?

Adding up the orders for cheese, ham and tuna, we have .
If he had orders in total, then must have been ham.
Question 2: Brian measured the height of his tomato plants, to the nearest , and recorded the results in the table below.

a) How many plants were between and ?
[1 mark]
b) How many plants were or below?
[1 mark]
c) Brian says over half his plants are taller than . Is he correct? Show how you decide.
[3 marks]
a) Reading across the row for , we can see that were in this category.
b) This is the first two categories added together. There are plants that were or shorter.
c) Adding up the frequency column, Brian has plants in total.
Looking at the last two categories, plants are taller than .
So Brian is correct, as is more than half of his plants.
Question 3: A class of children were split into group A and group B. They were all asked to choose their favourite subject. The information is shown in the table.
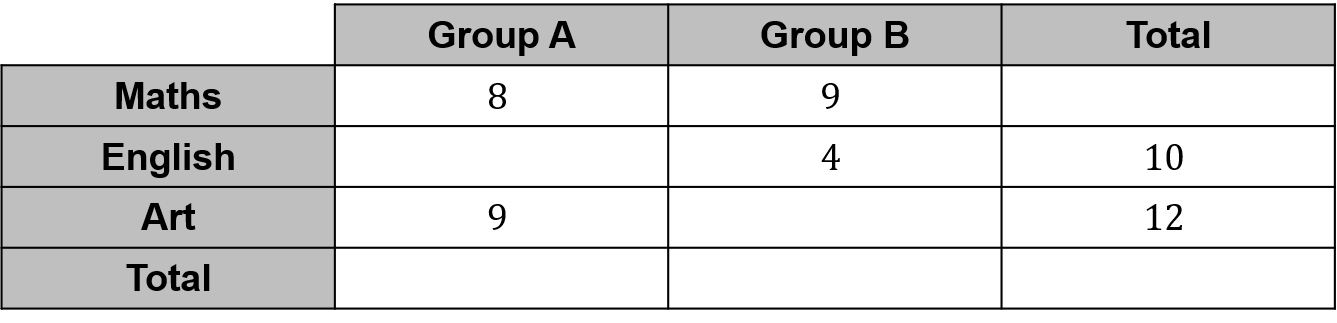
a) How many children in group A chose English?
[1 mark]
b) Which group had more children?
[3 marks]
c) How many children were there in total?
[1 mark]
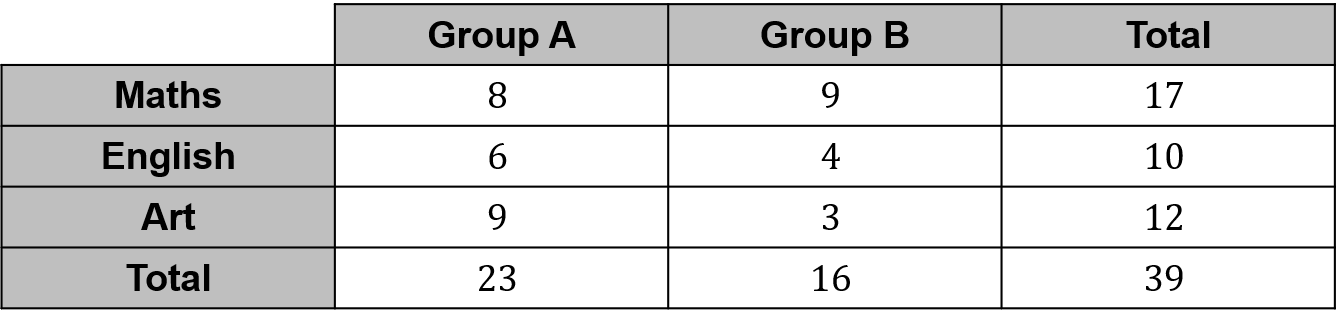
a) We know the row for English adds up to , so the number of children in group A who chose English must be
b) The missing value for art in group B is
So the total for group A is
And the total for group B is
Group A had more children.
c) Adding up the total for group A and Group B, there are children in total.
The completed table looks like this: